The short version of this week (26–27 August): a tool this project leans on turns out to be blind to half of what it is supposed to catch, and the way it hid that is specific enough to be worth writing down. This is the last part of an arc whose big idea died on 26 August. The instruments outlived it, and they keep turning out to be more interesting than the thing they were built for.
The number only covered one thing
Here is the setup, in the plainest words I have.
I have a piece of music and a tool that reads it. The tool does not know what the music is supposed to sound like. It just goes through the track in five-second slices and asks, for each slice, whether anything about it stands out compared to the rest of the track. If something does, it raises a flag.
To find out whether that works, I plant faults on purpose. I take a clean track, damage it in a way I control exactly, and see whether the tool notices. Last time I planted a steady tone — think of a faint whistle sitting under the music — and turned it down step by step until the tool stopped flagging it. It stopped at about −40 dBFS, which is quiet: far below the music, but not nothing.
That number does real work. It turns we found nothing into a sentence with a number in it, which was the whole point of the previous part.
Then I reread what I had written underneath the result. Measured one type, one frequency, one song.
I can plant five kinds of fault, not one:
- a tone — something added, a whistle
- clicks — something added, tiny sharp pops
- a band cut — something removed, the top of the sound sliced off
- an MP3 round-trip — a bad copy, the damage a low-bitrate codec does
- a mel round-trip — a smeared copy, fine detail blurred away
Only the first of those had a number. So I went to get the other four.
The bench could not do it, and would not have told me
My notes from 26 August said the other four types were “one command away”, so this should have been quick.
They weren’t, and the way they weren’t is the first thing worth telling you.
The calibration bench takes a list of strengths and plants the fault once at each. But “strength” means something different for each kind of fault. For the tone it is a volume in decibels. For a band cut it is the frequency you cut above. For MP3 it is the bitrate. The bench was writing every number I gave it into the volume setting — and only the tone reads that setting. The other four just ignored it.
So I checked before running anything. I planted a band cut at “−35” and again at “−45”, and compared the two files.
They were identical. Byte for byte, the same file.
The bench would have run happily, printed six neat rows, and every row would have been the same track measured six times. It would have looked exactly like a calibration.
I fixed it so each fault type names the setting its strength actually lives in, and so the bench refuses to run if you hand it that setting yourself — the exact mistake cannot come back quietly. Then I re-ran the old tone calibration to check I had not broken anything on the way. It came back identical to the published table, to the second decimal.
Only then did I measure the other four.
What came back, and it is not close
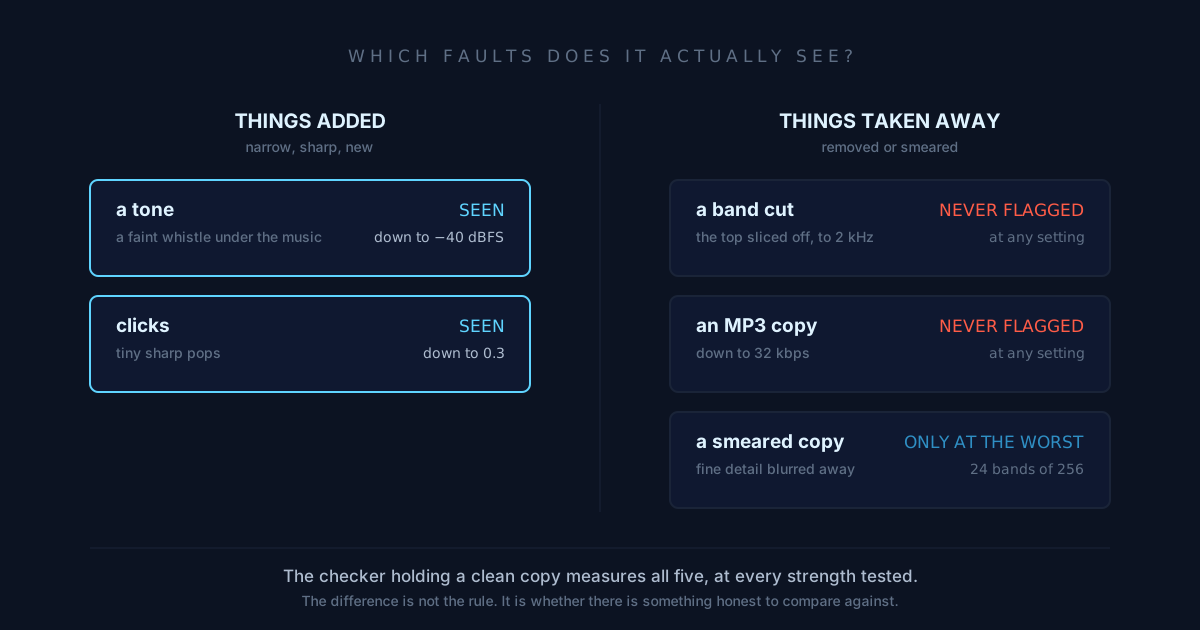
| fault | I varied | across | the tool, on its own | the checker, holding the answer key |
|---|---|---|---|---|
| band cut | cut frequency | 16 kHz → 2 kHz |
never flags it | 14.09 → 21.05 dB |
| MP3 copy | bitrate | 192 → 32 kbps |
never flags it | 9.03 → 43.30 dB |
| smeared copy | detail kept | 256 → 24 bands |
only at the very worst | 5.38 → 10.01 dB |
| tone | volume | −35 → −50 dBFS |
down to −40 |
14.03 → 2.46 dB |
| clicks | loudness | 0.8 → 0.1 |
down to 0.3 |
10.98 → −0.00 dB |
The two it catches are the tone and the clicks. Both of those add something to the track — something narrow, something sharp.
The three it misses all remove or smear.
The band cut is the row that matters. At the bottom of it, everything above 2 kHz is chopped off a six-and-a-half second stretch of music. That is not subtle. Half the spectrum is gone; anyone would hear it instantly as the music going muffled and then clearing up again. The checker that holds the answer key measures it at 21 dB, which is enormous.
The tool never says a word. Not at 2 kHz, not anywhere in between, not once.
Same for the MP3 copy at 32 kbps, which sounds like a bad phone call.
Why: the ruler is made out of the track
This is the mechanism, and it is worth going slowly.
The tool has no idea what music should sound like, and that is deliberate. It gets its sense of normal from the track itself: it looks at all twenty-one slices, works out what a typical slice looks like and how much slices normally vary, and flags anything sitting too far outside that. It works on any material with no training and no reference recording.
But look at what happens when a fault goes in.
The fault joins the comparison group.
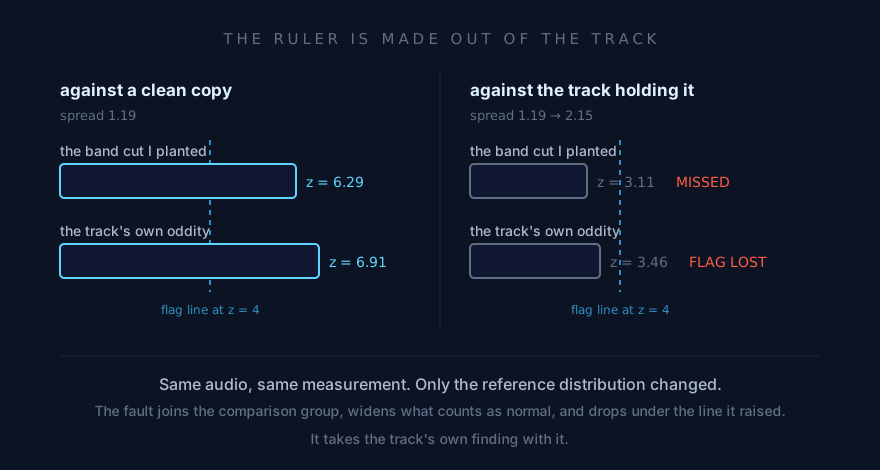
Take the worst band cut. In the slice holding it, the energy up in the treble drops by 8.26 dB. Measured against a clean copy of the same track, that lands at 6.3 standard deviations out — vastly past the line the tool draws at 4. It should be flagged and it should not be close.
But the tool is not comparing to a clean copy. It is comparing to this track, and this track now contains the fault. And the fault does not just sit low; it stretches the range of normal the track has:
| treble energy across the track | typical slice | how much slices vary |
|---|---|---|
| clean | −45.77 |
1.19 |
| with the band cut planted | −46.54 |
2.15 |
The variation nearly doubles, and that number is the denominator for every slice. So the fault, which was 6.3 deviations out, becomes 3.1 deviations out — under the line, unflagged.
And the same widened ruler is applied to everything else. There was a genuinely odd slice at the very start of this track, 6.9 deviations out, which the tool had always flagged. With the fault planted elsewhere it drops to 3.5, and the flag disappears.
It also goes wrong in the wrong place
Two things fall out of that mechanism, and both of them land away from where the fault actually is.
It raises alarms somewhere else. With the tone planted at −35 dBFS between 61.4 and 68.2 seconds, the tool flags a slice at 5 to 10 seconds — fifty seconds away, where nothing was planted at all. The tone lifted the noise floor in its own slice, that shifted the reference for the whole series, and a quiet slice at the other end of the track crossed the line as a result.
And it deletes findings somewhere else. The band cut and the MP3 copy each take the track’s own flag count from 20 down to 16 — and not one of the four that vanished is anywhere near the planted damage.
A version of this had shown up before, but only with a fault smeared across the whole track, which looked like a special case. It is not. Six and a half seconds is enough.
I wrote down the fix, tested it, and it lost
The repair looked obvious. I wrote it down as a prediction before testing it, which is the only reason there is a clean record of it losing.
If the problem is that the fault gets into its own reference group, then leave it out. Judge every slice against a reference built from all the other slices. Simple, cheap, one line.
I ran the null test first — what does this rule do to a clean track, where every flag it raises is a false one — because the whole point of the previous part was that you measure the empty case before you interpret anything.
| rule | flags raised on the clean track | finds the band cut? | finds the MP3 copy? |
|---|---|---|---|
| current | 20 |
no, at any setting | no, at any setting |
| leave-one-out | 24 |
no, at any setting | no, at any setting |
More false alarms, not one new detection.
The reason is in the MATH BOX and it is not subtle once you see it: the planted fault covers two slices of the grid. Leave one out and the other is still there, still stretching the ruler. Leaving both out would mean knowing where the fault is — and knowing that removes the need for the detector.
So there is no cheap fix. The rule would need a reference from outside the track — a clean copy to compare against. Which is exactly what the checker holding the answer key has, and exactly why it sees all five faults at every strength while the tool on its own sees two.
That is a tidy little circle to end an arc on. The thing that separates a detector from a checker is not the cleverness of the rule. It is whether it has something honest to compare to.
What I would keep from this
- A detector that builds its reference out of the thing it is inspecting can be defeated by the thing it is inspecting. Not fooled by a clever attacker — defeated by an ordinary fault, arithmetically, with nobody trying.
- Ask which direction your detector works in. Mine notices additions and is blind to subtractions, and nothing in its description says so, and the question had not been asked until now.
- A single flag is not a location. Mine raises alarms fifty seconds from the damage. If I had shipped a tool that pointed at a timestamp, it would have been pointing at innocent audio.
- Fewer warnings is not a cleaner track. This is the one I would put in the specification in bold.
- A detection floor belongs to a fault type, not to a tool. “−40 dBFS” was true, and it was being quoted too broadly by exactly four fifths.
- An instrument that degrades silently is worse than one that fails. Mine would have printed a perfectly formatted calibration of the same file six times. The check that caught it was one command: plant twice, compare the files.
The concept that all this was built for died on 26 August, by a kill condition written down in advance. The instruments have overturned three written-down conclusions since, including one from 27 August.
Sources & further reading
- V. Barnett & T. Lewis, Outliers in Statistical Data (3rd ed., 1994) — masking and swamping as the two standard failure modes of self-referential outlier rules.
- A.S. Hadi & J.S. Simonoff, Procedures for the Identification of Multiple Outliers in Linear Models (JASA, 1993) — why one-at-a-time deletion is defeated by more than one outlier.
- P.L. Davies & U. Gather, The Identification of Multiple Outliers (JASA, 1993) — outlier identifiers, and the price of estimating your own reference from contaminated data.
- P.J. Rousseeuw & A.M. Leroy, Robust Regression and Outlier Detection (1987) — the high-breakdown alternative to single-deletion diagnostics.
- F.R. Hampel, A General Qualitative Definition of Robustness (Annals of Mathematical Statistics, 1971) — the breakdown point, and why the median held while the spread estimate did not.
- P.J. Rousseeuw & C. Croux, Alternatives to the Median Absolute Deviation (JASA, 1993) — what the MAD is and is not immune to.
- L.A. Currie, Limits for Qualitative Detection and Quantitative Determination (Analytical Chemistry, 1968) — the detection limit as a property of method and material together, not of the instrument alone.
— SF3D